NUTRITION
The BisonBasics Nutritional Comparison Chart
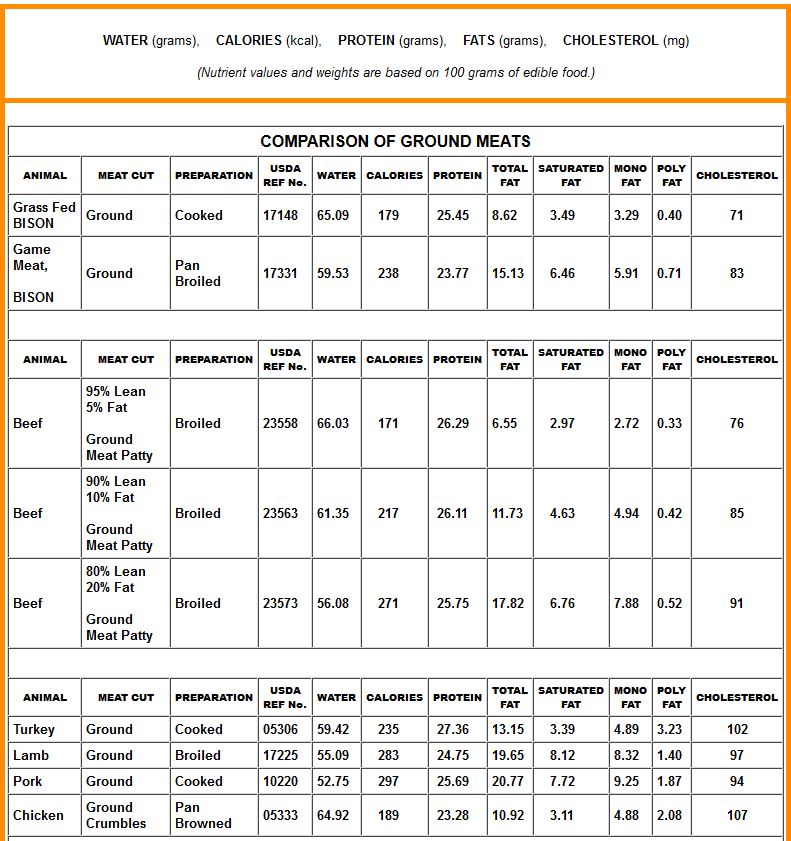
At Bisonbasics.com over 65% of our recipe inquiries are for ways to prepare ground bison. This includes burgers, meatballs, meatloaf, chili and the like. The following chart compares uncooked grass-fed ground bison to ground beef, turkey, pork, and chicken. All data as per the USDA National Nutrient Database for Standard Reference.

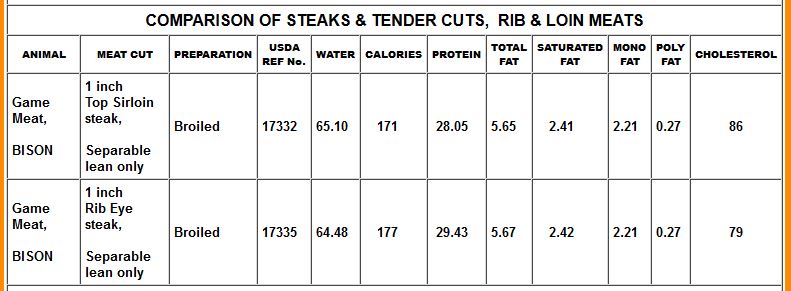
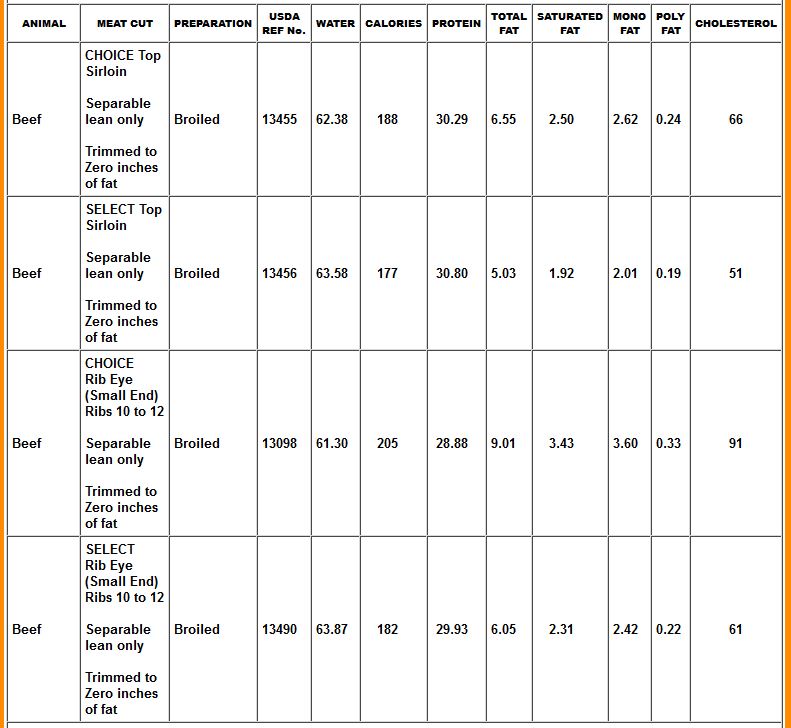
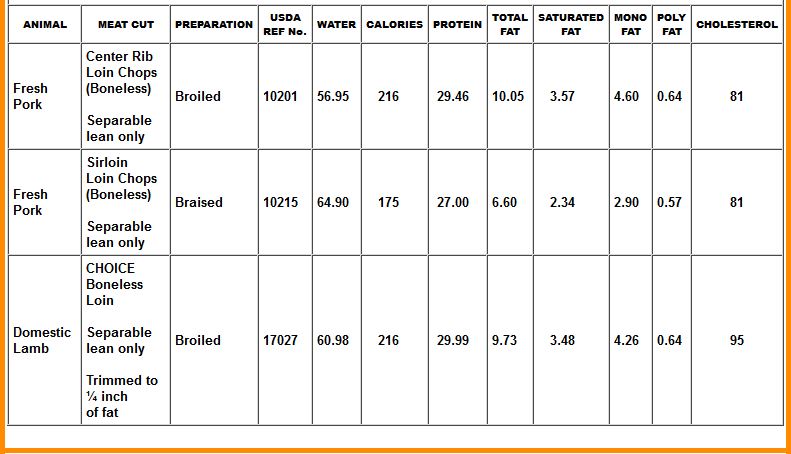
Bison Basics Nutritional Comparison Chart for Cooked Meat
Bison Nutrient Values Can, And Do, Differ
To be of specific value to you, the consumer, nutritional testing is best done at the individual farm level. For general comparative purposes USDA data is adequate, but it cannot be expected to accurately apply to the same cut of bison from different sources. In numerous situations, nutrient values for meat from different bison farms differs from USDA Nutrient Database information.
Nutrient measurement, like all fields of measurement, uses instruments and techniques that are less than perfect. Observation and transcription errors do occur even in the hands of the most competent researchers, but this is the least of our concerns when it comes to bison meat nutrient measurements. Since bison are not raised in strictly controlled feeding environments, obtaining completely accurate nutrient information can be a challenge. At times inconsistencies may only exist at a micro-nutrient level. In other instances a macro nutrient, such as fat, which can vary from cut to cut, will, depending on feeding practices, also vary from bison to bison.
There are a number of reasons why this is the case. First, like all farm animals, bison are a product of their own immediate environment. For bison that environment is primarily pasture. What bison consume while being pastured, which can differ from farm to farm, is a determinant when it comes to nutrient values. Weather conditions, herd rotation, pasture management and soil treatments (if applicable) will all affect pasture quality, and ultimately the nutritional profile for the meat.
Nutrient values in bison meat can also be affected by supplemental vitamin and mineral feeding which is farm specific. The quality and types of hay consumed by bison when fresh pasture is not available is another factor, and supplemental grain feeding and finishing, where practiced, is yet another determinant.
Besides feeding variables, nutrient values can be affected by breeding and genetics, age and sex, and even the time of year when a bison is harvested.
Testing conducted at farms utilizing consistent feeding protocols is the only way to be more certain of nutrient values for the bison meat you consume. Unfortunately, the cost benefit of conducting such testing is prohibitive.
For bison, the nutritional data used most often is from the USDA's National Nutrient Database for Standard Reference. But because of aforementioned factors, the data on bison is best considered approximate. Still, BisonBasics maintains that when the most appropriate USDA data is chosen, the result is a better informed consumer. It is not clear that the same claim can be made when consumer opinion is based on limited, less clear information made available through some bison association and affiliate member websites.
Further Examination Of The Problems With Commonly Available Information
What is widely available and used by many farms and regional associations in the promotion and marketing of bison is the National Bison Association's (NBA) Nutritional Comparison Chart. The Canadian Bison Association's 'Nutrient Composition' chart varies only slightly--more on that later.
A large part of the problem with charting nutritional data is due to the lack of comprehensive and up-to-date information care of the USDA, the only national public service organization to research and provide such data. Unfortunately as far as research data is concerned, bison is sadly lacking when compared to beef. There are 712 items listed under USDA's 'beef' heading, but only 15 for 'bison'. The bison industry has of course grown considerably over the past decade and become more profitable. But not to a point where officials can be convinced through lobbying efforts, which are largely unaffordable, that more research data related to bison nutrition is warranted. It will continue to be a slow process.
USDA 'Roasted' Bison - Not The Best Choice For Comparative Purposes
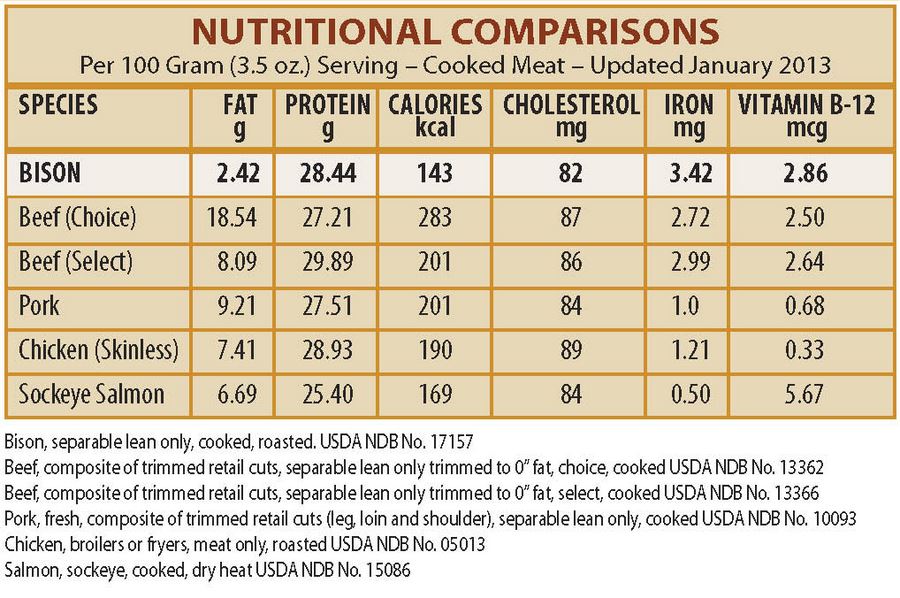
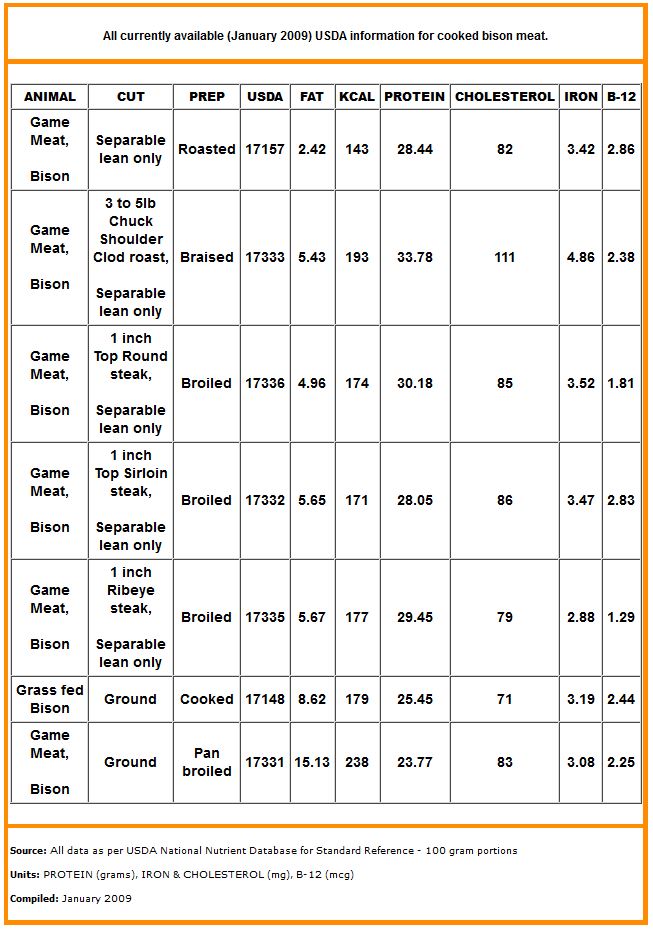
Seven of the 15 items listed by the USDA relate to cooked bison. The only cooked bison item included in the NBA Nutritional Comparisons chart is: Game meat, bison, separable lean only, cooked, roasted', NDB # 17157.
The problem with this data is that it is not clear what it represents. Do the numbers represent composite information for several roasts from different parts of a single bison? Or is this composite information for the exact same cut from numerous bison; and if so, how many bison equal 'numerous'? Or could all the data be based on just one single bison roast? It's not at all clear.
One reason this data was chosen by the NBA may be the fact that item #17157 has the lowest fat in the entire cooked bison category---2.42 gm. total fat per 100 grams of cooked meat. Another reason…… this category of bison meat (17157) has the lowest caloric value (143 kcal) of the six foods listed on the NBA chart. And thirdly, this choice also has the lowest caloric value for all the cooked bison items listed on the USDA site.
Although the numbers look good, this single line of data for bison is not much use to the consumer. It clearly represents a set of nutritional values for non-specific bison cuts prepared using a cooking process that the majority of bison consumers don't utilize - roasting!
Other USDA data as it relates to cooked bison is available in the BisonBasics Appendix 'A' chart. Fortunately the remaining 6 items in the cooked bison meat category are more specific and/or relevant to consumer needs than item #17157.
Other Problems With The NBA's Nutritional Comparison Chart
Both the beef choice item (13362) and the beef select item (13365) are based on a 'composite of trimmed retail cuts, separable lean only, trimmed to 0" fat, cooked'. (Please note the NBA site appears to use the 13362 code which is not correct for the description provided. 13365 is the correct data code.) A 'composite of trimmed retail cuts' can include just about any cut from neck to tail. Many may find such data too general to be of any relevant or comparative value.
The situation is not that much different for pork which is not listed in the form of a specific comparative cut either. The information charted is for 'Pork, fresh, composite of trimmed retail cuts, (leg, loin, shoulder) separable lean only, cooked'. Again, this information is too general to be of much value.
Although comparing nutrient data between similar cuts of bison, beef, and pork is possible, poultry not having the same anatomy is a bit of a comparative stretch. Granted nutrient data for chicken can be of some value. But the NBA listing is for skinless 'meat only roasted' broilers or fryers (05013). The question is, 'How many people actually prepare and eat skinless meat only chicken?'. For comparative data to be relevant, perhaps the Nutritional Comparisons chart should have included information on chicken that people are more likely to eat. This could include skin-on fried chicken, rotisserie chicken, or even fast food chicken like KFC's or Popeye's. Better still; why not just compare ground bison to ground chicken or turkey?
Sockeye Salmon Gets Unfair Treatment
At the bottom of the NBA's Nutritional Comparisons chart is Sockeye Salmon. The USDA reference is 'Salmon, sockeye, cooked, dry heat' (15086). What is most noteworthy here is the figure listed for fat content, 10.97 grams. According to the NBA's chart, sockeye salmon has 4 ½ times more fat than bison. And it is true, salmon does have 4 ½ times more total fat than bison. But by not explaining the fact that sockeye salmon contains mostly very healthy fats, consumers not in know are mislead into believing that 4 ½ times more fat is just plain bad news.
According to the USDA, the sockeye salmon cited by the NBA contains: 1.97 grams saturated fat, 5.29 grams monounsaturated fat, and 2.409 grams polyunsaturated fat. The bison has: .91 grams saturated fat, .95 grams monounsaturated fat, and .24 grams polyunsaturated fat.
When compared to the sockeye salmon portion, the fat values for the bison sample are of limited health value. The amount of total fat contained in sockeye salmon is very healthy in that nearly 75% of it is completely unsaturated. Of that unsaturated portion, the polyunsaturates are 10 times higher than what can be found in the bison sample.
Polyunsaturated fats include fatty acids from the Omega-6 and the Omega-3 families. Both are necessary for good health. But sometimes our diets, being overly grain/cereal based, can be too high in Omega-6. Yes, eating 100% grass-fed bison can help maintain a healthy Omega 6/Omega 3 profile. But the health benefits derived from consuming fatty fish high in Omega-3s, as is the case with sockeye salmon, should not be ignored or relegated to the bottom of any nutritional comparison chart.
Canadian Bison Association's Nutrient Composition Chart…..Not An Improvement
Unfortunately the Canadian Bison Association's (CBA) 'Nutrient Composition' Chart fares no better than the NBA's nutritional chart. In fact, in comparison, the CBA chart would have to be considered even less informative. Two categories of analysis, Vitamin B-12, and more importantly 'protein content' are not included for any of the foods. Data provided on the CBA website is based on information from the dated 2001 Canadian Nutrient File (CNF)
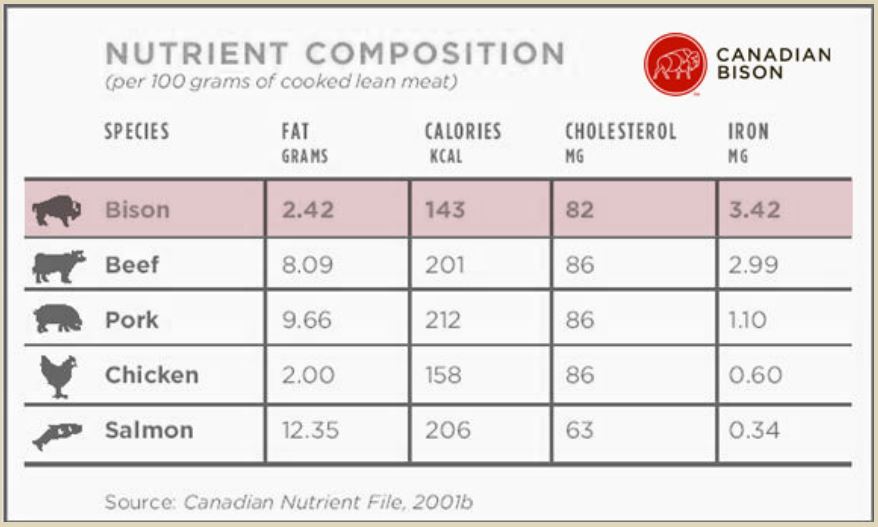
To the credit of the NBA, that organization has used nutrient file identifiers in its analysis, while the CBA has chosen not to. No matter though. The information for bison and pork is identical. The information for beef (select) is also the same; although differences in the Canadian beef grading system suggests the nutritional data listed on the Canadian chart should be slightly different.
The CBA chicken data is different from the NBA's and appears to be for roasted skinless chicken breast meat. Although not exact, the closest data seems to be associated with CNF item #892. Still, as is the case with the NBA, there are chicken products more common to the Canadian palate that would have been more appropriate than the skinless chicken item chosen.
The salmon listed at the bottom of the Canadian Bison Association's 'Nutrient Composition' chart is 'Salmon-Atlantic farmed, baked or broiled-CNF #3183. It too, like sockeye salmon, has an impressive nutritional profile. Unfortunately, farmed salmon is surrounded in controversy. Industrially farmed salmon has been known to spread sea lice to wild stocks and contaminate coastal environments. According to some critics, it can be unhealthy to consume. Organically farmed salmon, where obtainable, seems to be a more acceptable choice. Better still, choose sockeye salmon which is never farmed and widely available in cans.
Ontario's Cape Chin Bison Provides Farm Specific Nutrient Data
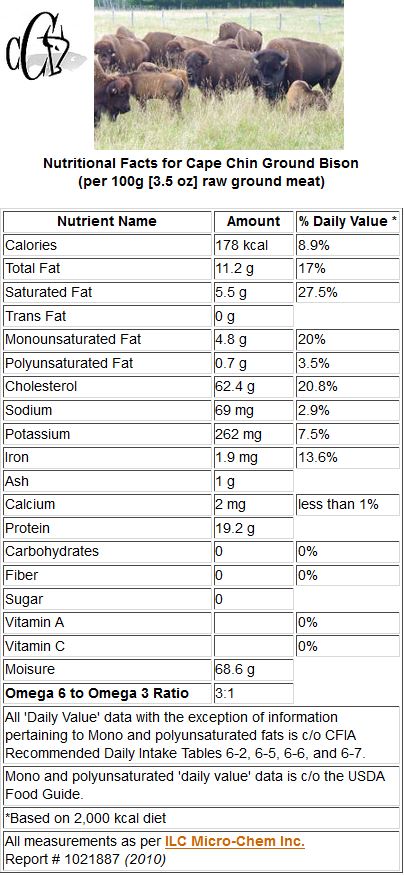
Grass-fed bison will usually have an Omega 6 to Omega 3 ratio of 4:1 or less when finished on fresh grass. Today's inexpensive nutritional testing procedures can verify this and supply other important 'farm specific' nutrient data. Although this type of nutritional testing for bison meat is not all that common, we did find that CAPE CHIN BISON north of Toronto does provide data for its ground bison. Cape Chin Bison Farm is one of the very few producers, if not the only one, that provide farm specific nutrient data for its 100% grass-fed ground bison. This sound business practice benefits both the farmer and the consumer. Let's hope more bison farms adopt this practice in future.
Dietary Reference Intake
It's also important to know the Dietary Reference Intake (DRIs) for bison meat, or what are more commonly know as the Recommended Dietary Allowances (RDAs). We have created a chart that summarizes the USDA data for the percentage of recommended daily intake (for adults over the age of 14) in 100g of edible Bison Ribeye Steak (NDB #17335) in order to show to what extent the various nutritional components meet your daily intake requirements.

Data based on USDA sources (Food and Nutrition Board, Institute of Medicine, National Academies) and The Omega Diet (Simopoulos and Robinson), Compiled: January 2009.
Note: This information should be treated as a general guideline only. Differences in nutritional requirements do exist between men and women and can be influenced by such factors as age, physical activity/caloric requirements, and certain health conditions. Understanding one's personal nutritional requirements are best done in consultation with a qualified dietition or nutritional expert.